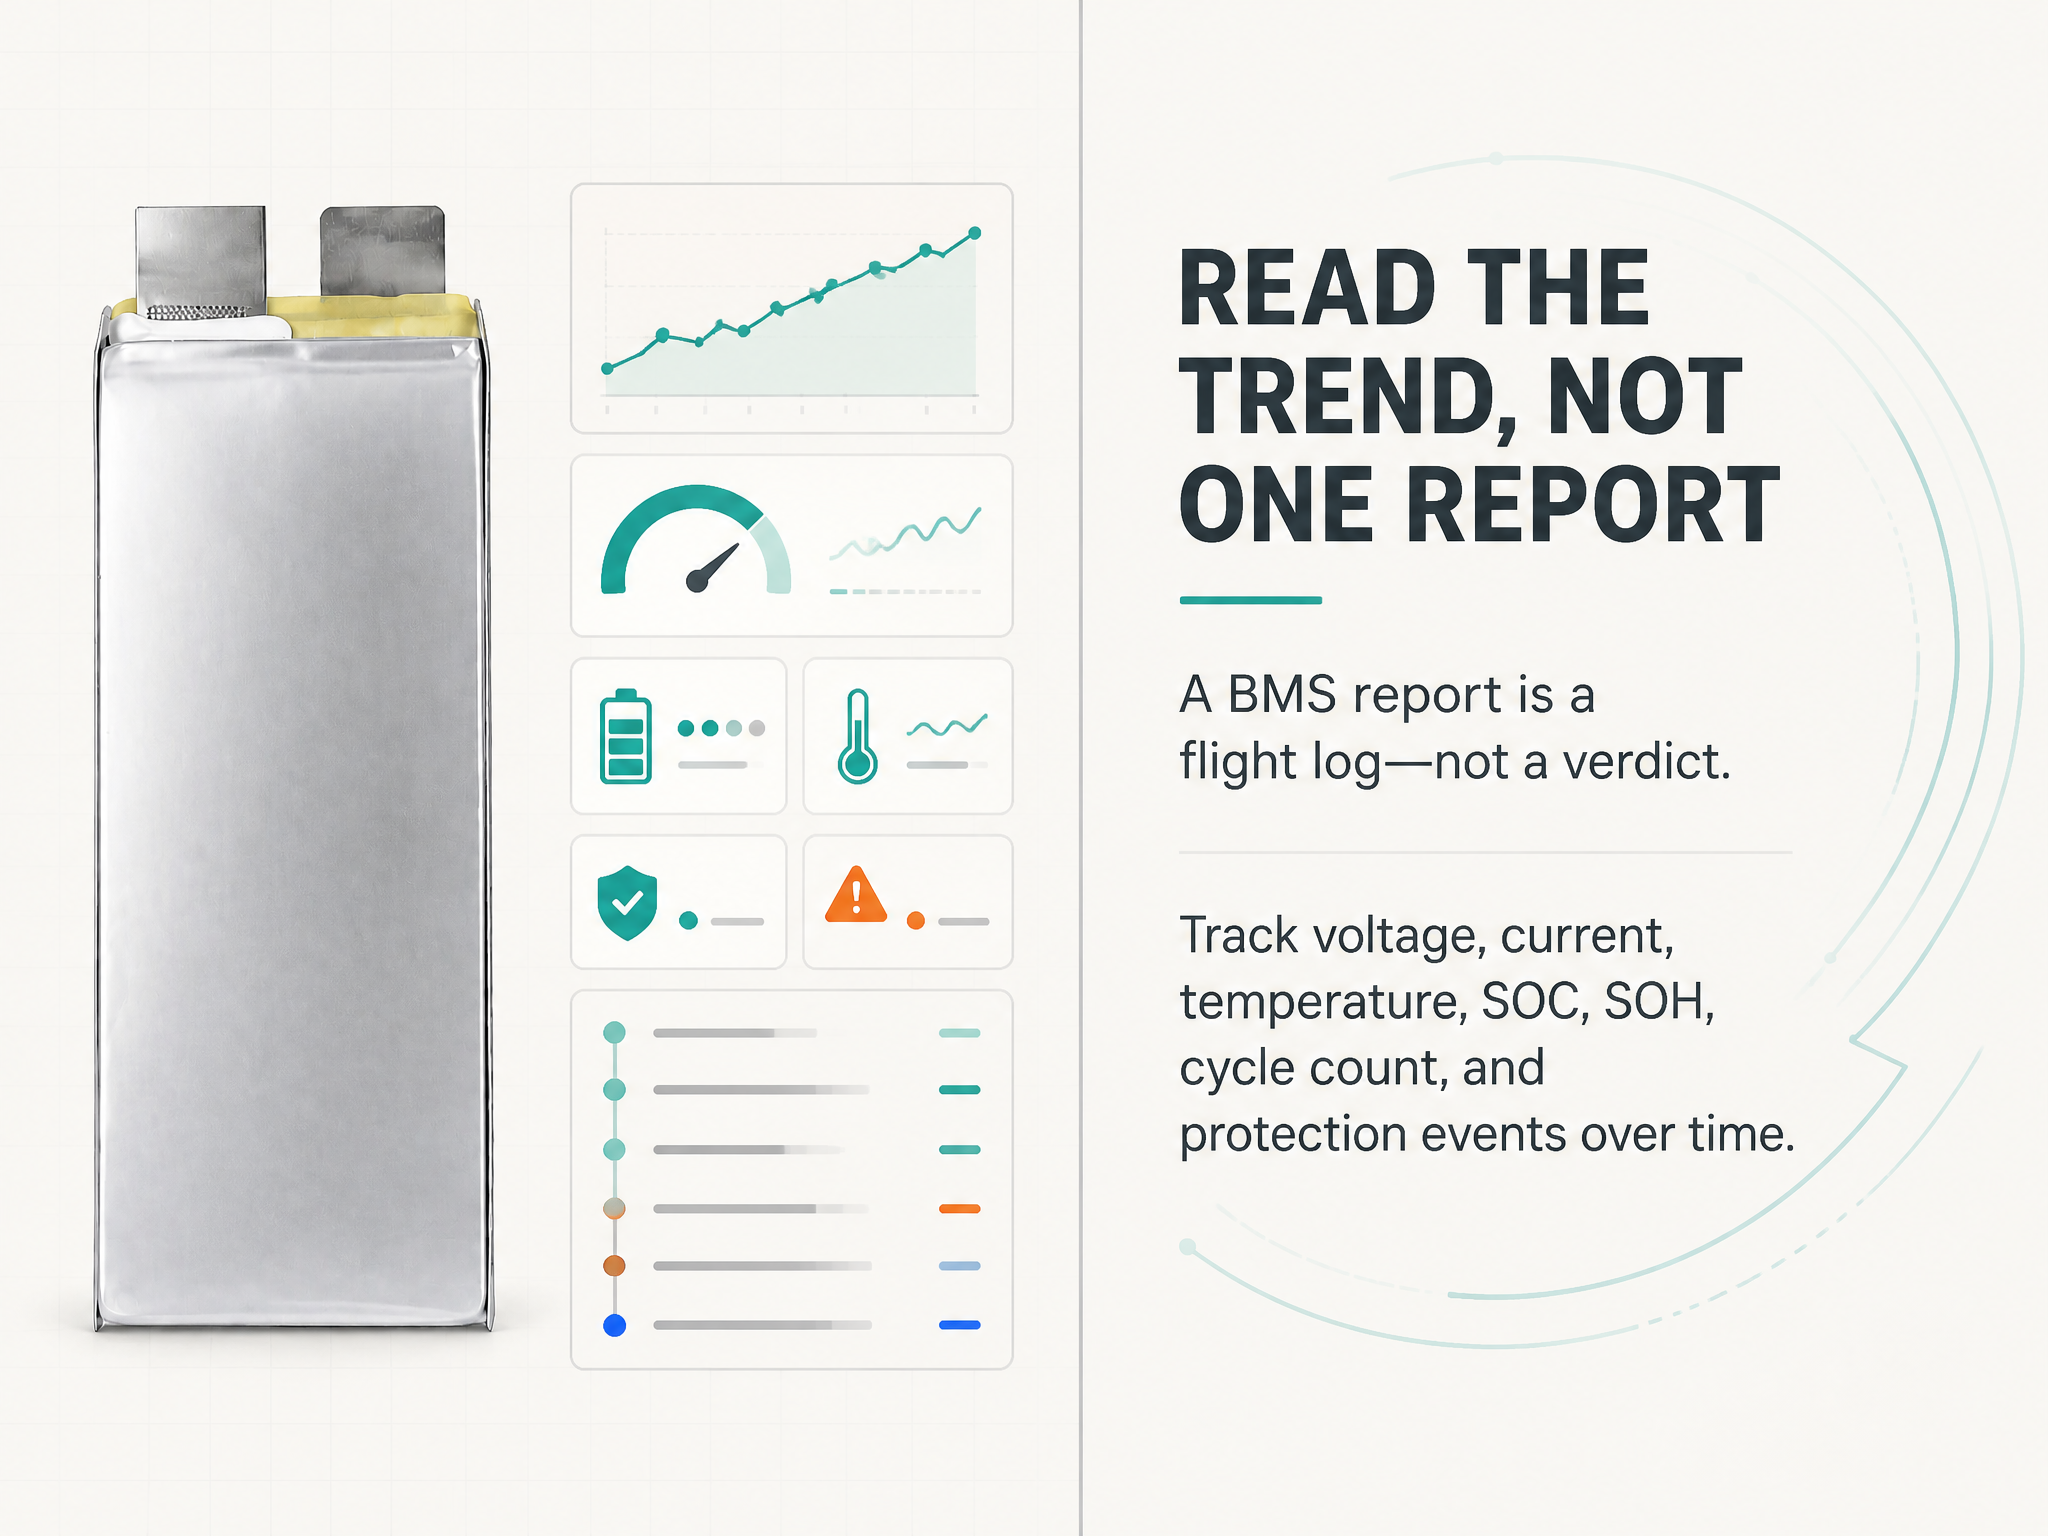
A BMS report is a flight log for the battery, not a verdict on it. It records what the pack did under a specific load, at a specific temperature, on a specific day. Read in isolation, a single report can mislead; read as a series, it becomes the cheapest predictive maintenance tool a drone fleet owns.
This guide explains what the main fields mean, where each one can mislead, and how to turn routine BMS downloads into a fleet health file that supports real decisions about dispatch, maintenance, and retirement.
What a typical BMS report contains
Most industrial UAV battery management systems export a time-stamped table covering pack voltage, individual cell voltages, pack current, state of charge (SOC), state of health (SOH) where supported, MOSFET and cell temperatures from one or more sensors, cycle count, and protection events such as over-voltage, under-voltage, over-current, short circuit, and over-temperature. More capable systems also log internal resistance estimates and balancing activity.
Two limitations matter from the start. First, the report describes the pack as the BMS measures it, and every measurement has a tolerance and a sampling interval. Second, the BMS sees electrical behaviour only. It does not see a bruised cell corner, a swollen pouch, a loose connector, or water inside the enclosure.
SOC: an estimate, and the method matters
State of charge is the BMS estimate of remaining capacity as a percentage. Three methods dominate: coulomb counting, which integrates current in and out; open-circuit-voltage lookup, which infers charge from a rested cell voltage; and model-based fusion of the two.
Coulomb counting drifts, because current-sense error accumulates over time. Voltage lookup is inaccurate while the pack is loaded, because internal resistance pulls the terminal voltage down. A pack at 45% SOC during a heavy climb may approach the low-voltage cut-off and then recover once the load is removed; that recovery does not mean usable energy came back.
Practical consequences: treat SOC as a trend indicator rather than a fuel gauge; compare SOC readings at similar points in comparable flights; and expect a periodic full charge and discharge calibration if the percentage must stay trustworthy. For dispatch decisions, define reserve in measured energy or in voltage under the mission load, not only in SOC percentage.
SOH: two curves, not one number
SOH is usually reported as a percentage of beginning-of-life capacity. That single figure hides a second, equally important curve: the growth of internal resistance.
A pack can retain 90% of its capacity while its DC internal resistance has risen by 25%. Capacity tells you how much energy remains; resistance tells you how much of that energy can actually be delivered at the currents the aircraft needs, and how much heat the pack will generate while doing it. A high-resistance pack at 90% SOH may sag below the aircraft minimum voltage during a takeoff that a low-resistance pack at the same SOH handles comfortably.
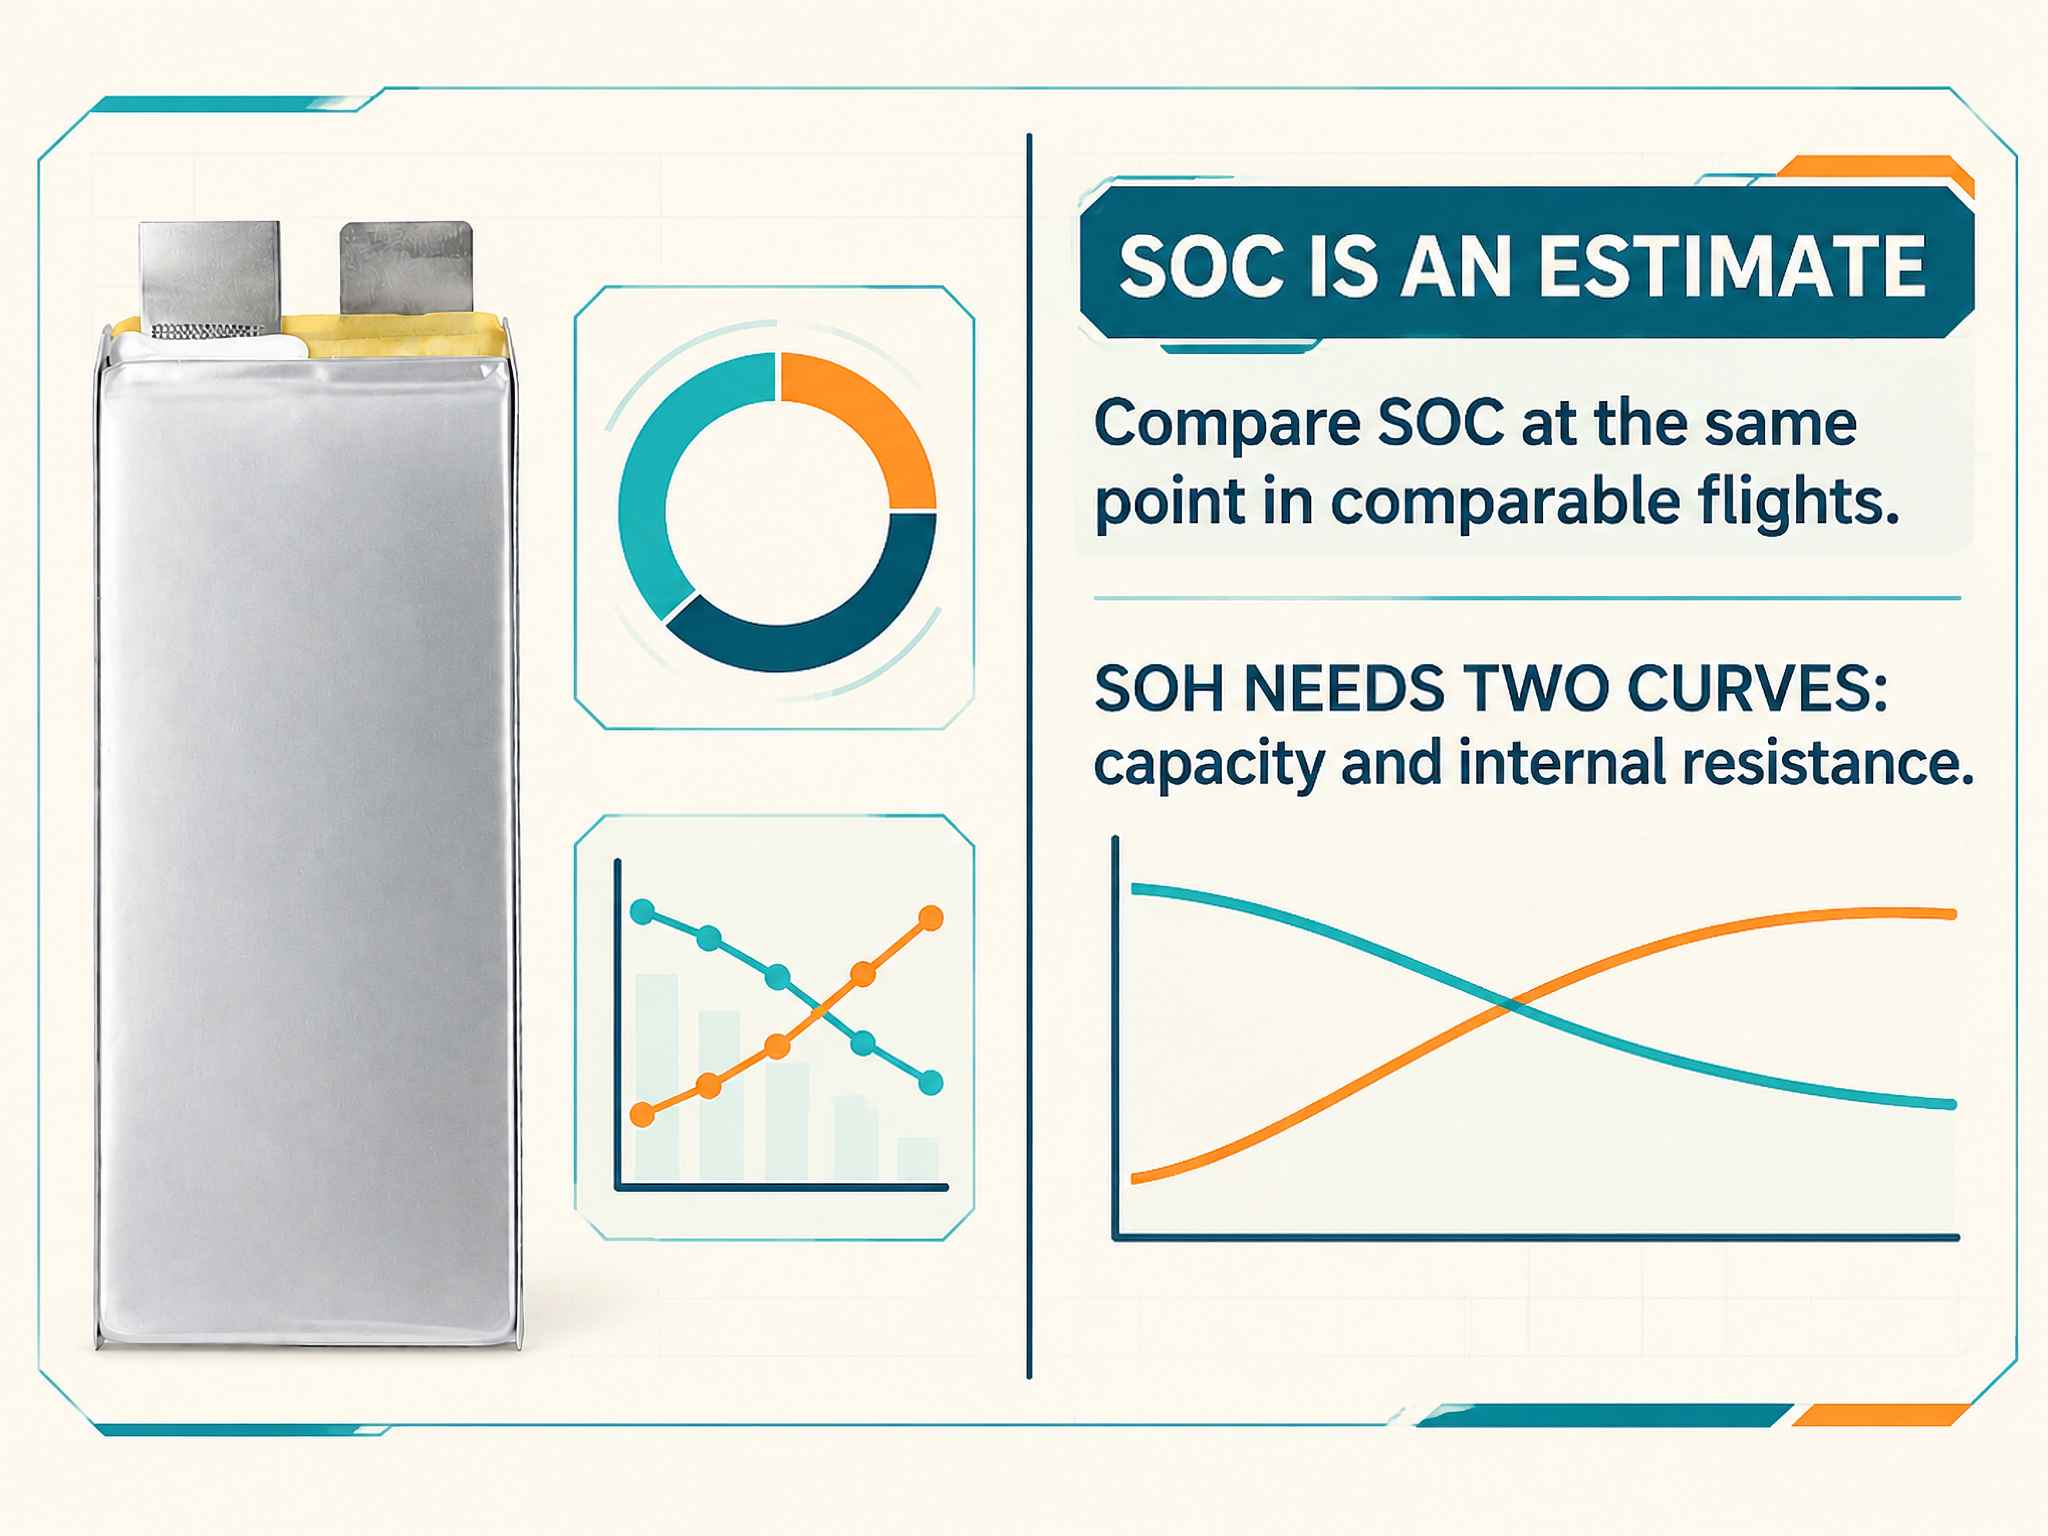
Treat SOH as a summary and DCIR as the diagnostic. Track them separately.
Cell imbalance: read delta V in context
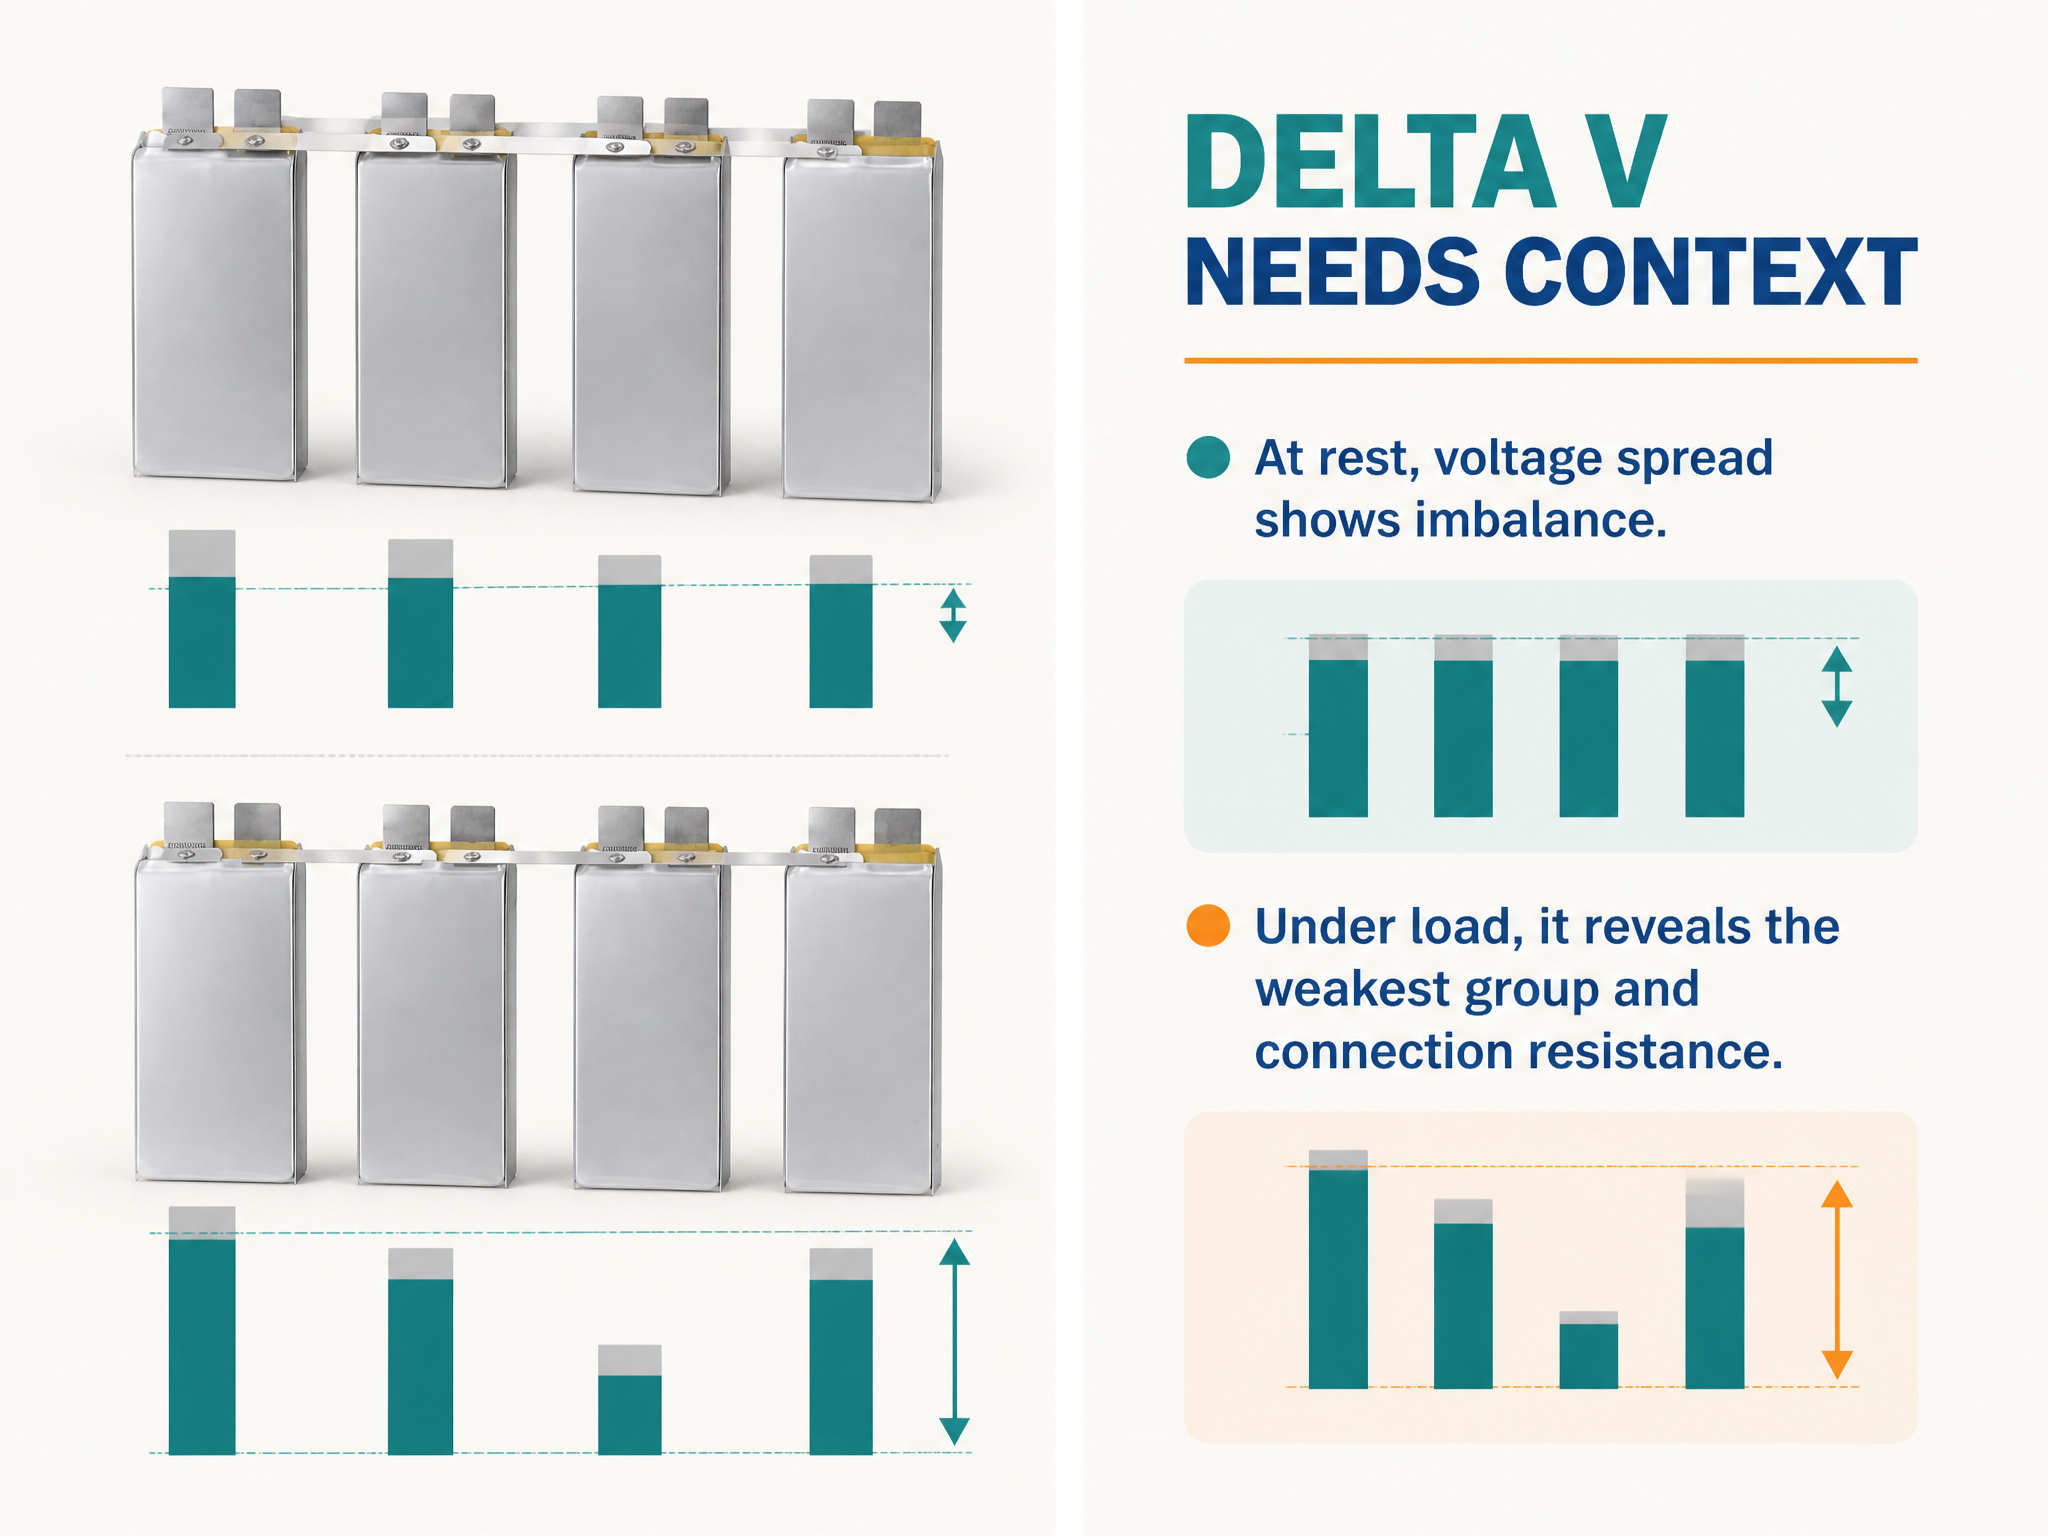
Cell imbalance is the spread between the highest and lowest cell voltage, usually shown as delta V or max minus min. The number is only meaningful alongside three conditions: whether the pack was at rest or under load, the current at that moment, and the temperature spread.
At rest, a healthy pack typically shows a small delta V. Under load, delta V widens because the weakest cell, with the highest resistance or the lowest capacity, drops further. A delta that grows sharply with current points to a resistance problem, often at a weld, busbar, or connector, not necessarily to a failing cell. A delta that is already large at rest points to genuine capacity or self-discharge mismatch.
Acceptable limits are cell- and pack-specific and must come from the supplier data, not from a generic rule. What matters operationally is the trend: a delta V that doubles over a few weeks under the same flight profile is a maintenance signal even while it remains inside specification.
Remember that the pack is limited by its weakest cell. The BMS will cut off on the lowest cell, so the remaining energy in the other cells is stranded.
Temperature: where the sensor sits changes the story
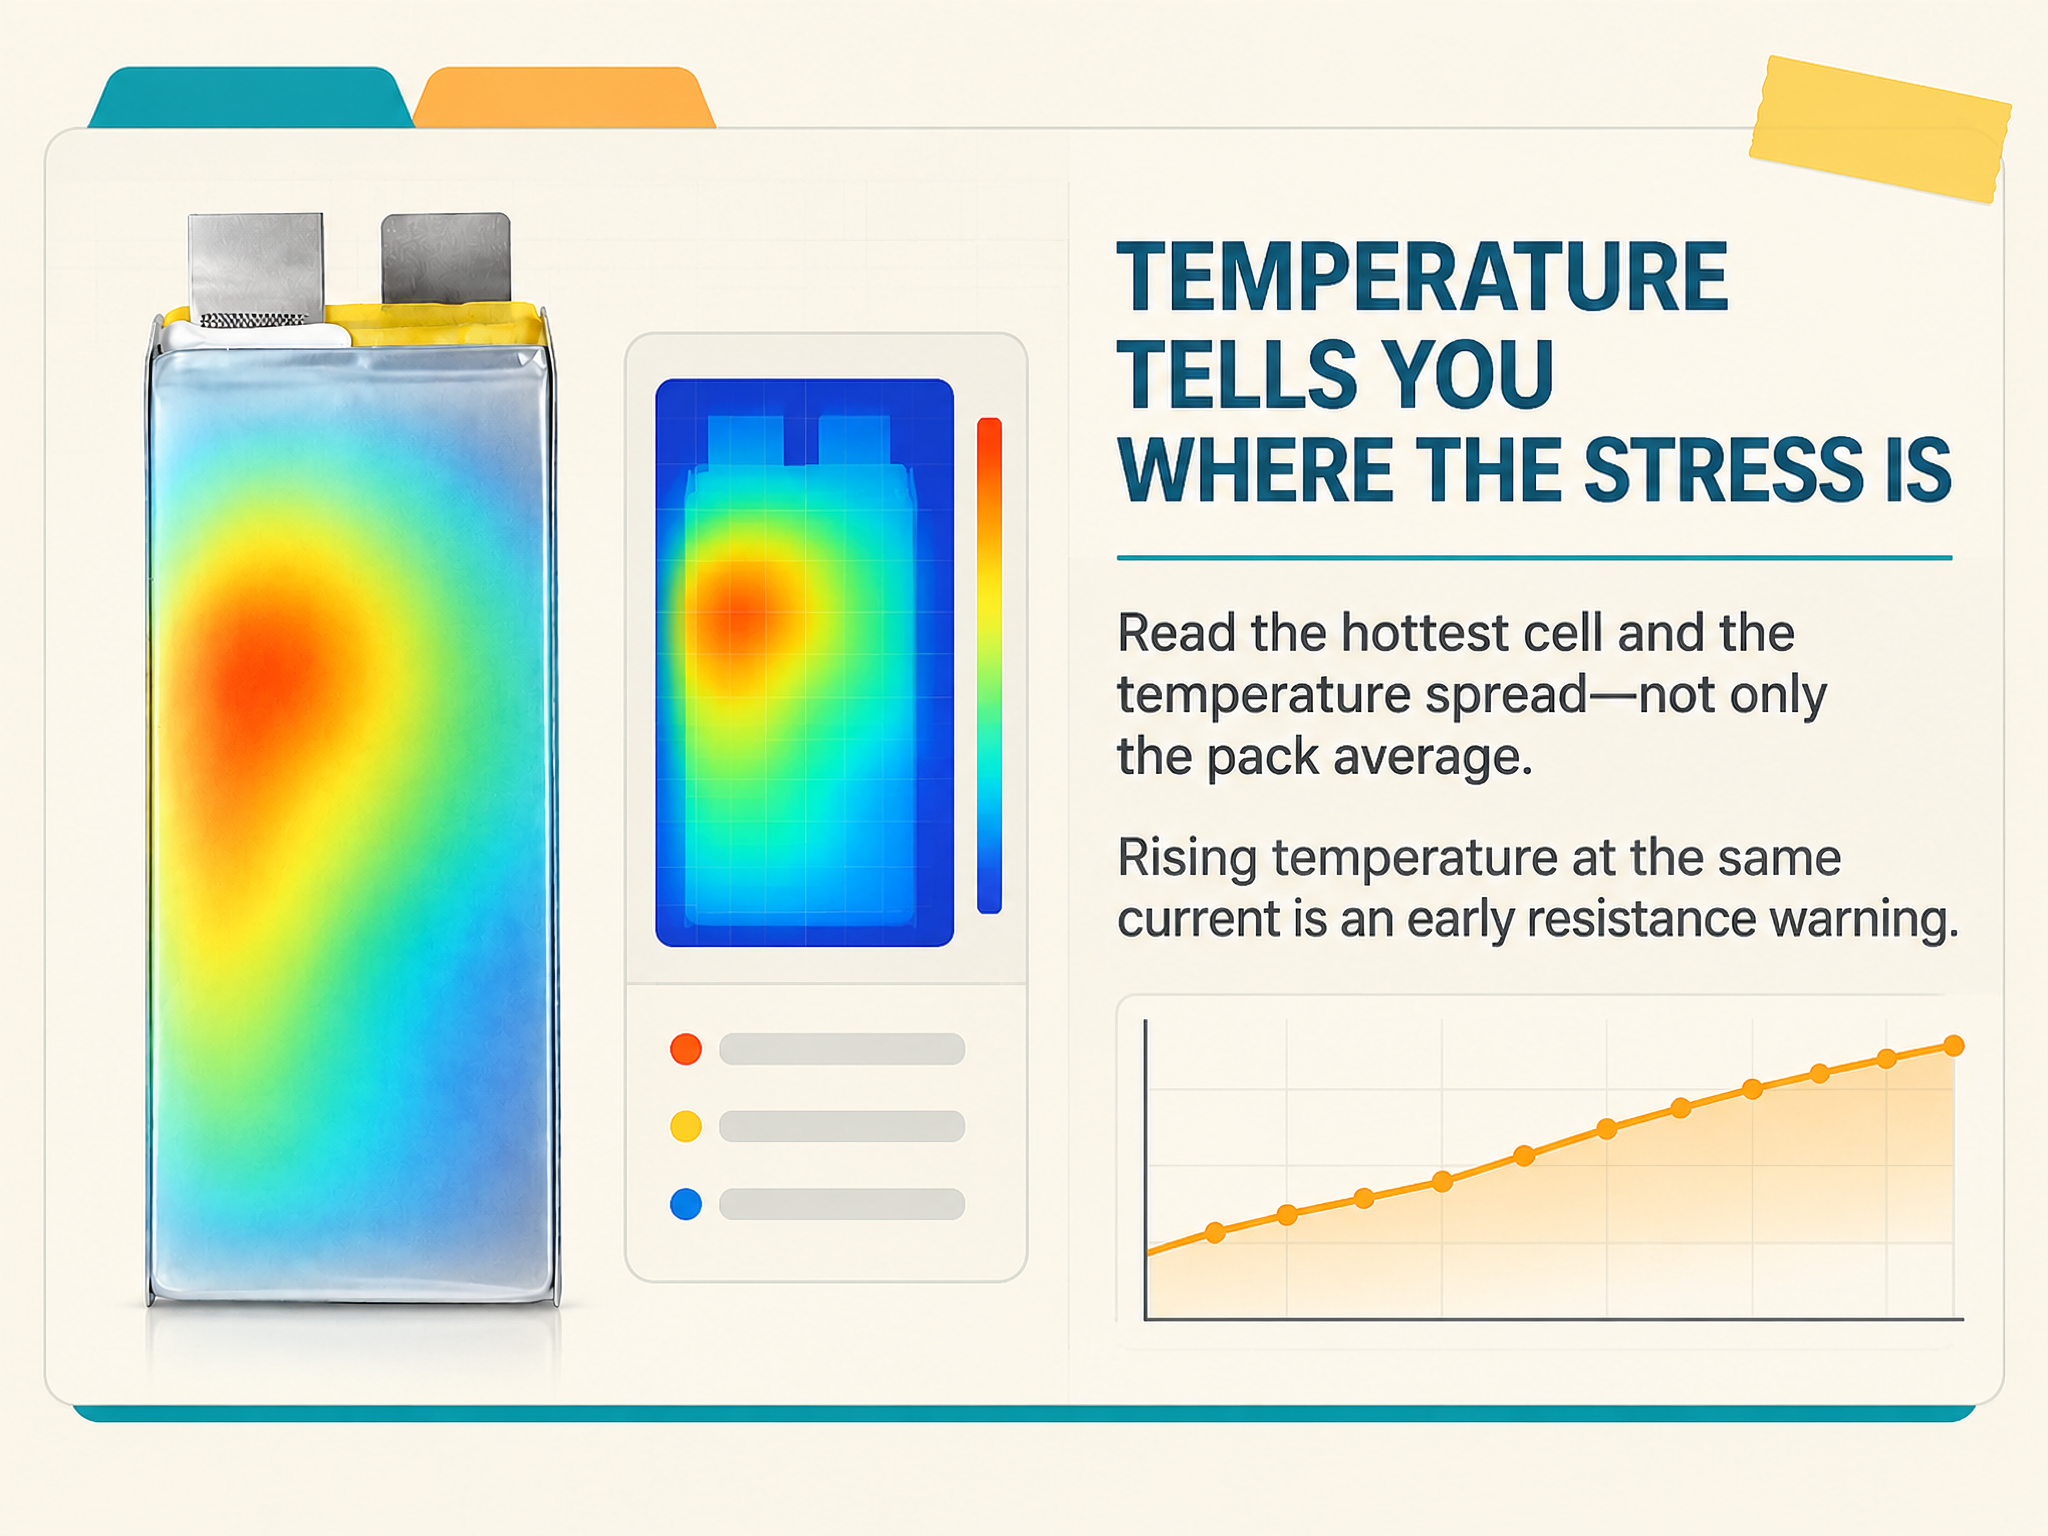
Temperature readings are only as good as sensor placement. A single sensor on the pack surface can miss a hot cell in the middle of the stack. Where multiple sensors exist, read the spread: a pack that averages 38 °C but contains one cell at 55 °C is not a 38 °C pack.
Two temperature windows matter, and they are not the same. Discharge limits are usually wider than charge limits. Charging a cold lithium-ion cell risks lithium plating on the anode, so the charge window must come from the cell datasheet and must be enforced by the BMS, not by operator habit.
Rising temperature at constant current is the clearest early sign of increasing resistance. A pack that used to land at 40 °C and now lands at 50 °C on the same mission has changed, even when every other reading looks normal.
Internal resistance trend: the slow, honest signal
DC internal resistance is computed from a current step and the corresponding voltage step. Absolute values are hard to compare across laboratories because they depend on pulse length, SOC, and temperature. What is comparable is the trend of one pack measured the same way over time.
A rising DCIR predicts three things: more voltage sag, more heat, and less usable energy at high current. It usually rises faster than capacity falls, so it is often the first usable warning of approaching end of life. Log it at a fixed SOC and temperature, for example a short pulse at 50% SOC and 25 °C, and plot it against cycle count.
Building a fleet health file
A fleet health file is a small, disciplined dataset, not a folder of PDFs. For each pack, record at minimum:
- pack serial number, cell model, and commissioning date;
- cycle count and cumulative energy throughput;
- SOH and DCIR, measured at a consistent SOC and temperature;
- delta V at rest and under a defined load;
- maximum and average cell temperature on the last mission;
- protection events, with the field conditions at the time.
Then add three working rules. Compare each pack against its own history, not only against the fleet average. Define trigger thresholds in advance, for example a delta V above a supplier-confirmed limit, a temperature spread above an agreed value, or a DCIR rise crossing a set percentage, and attach one action to each trigger. Review the data on a schedule: after every flight for high-value missions, weekly for routine agricultural work.
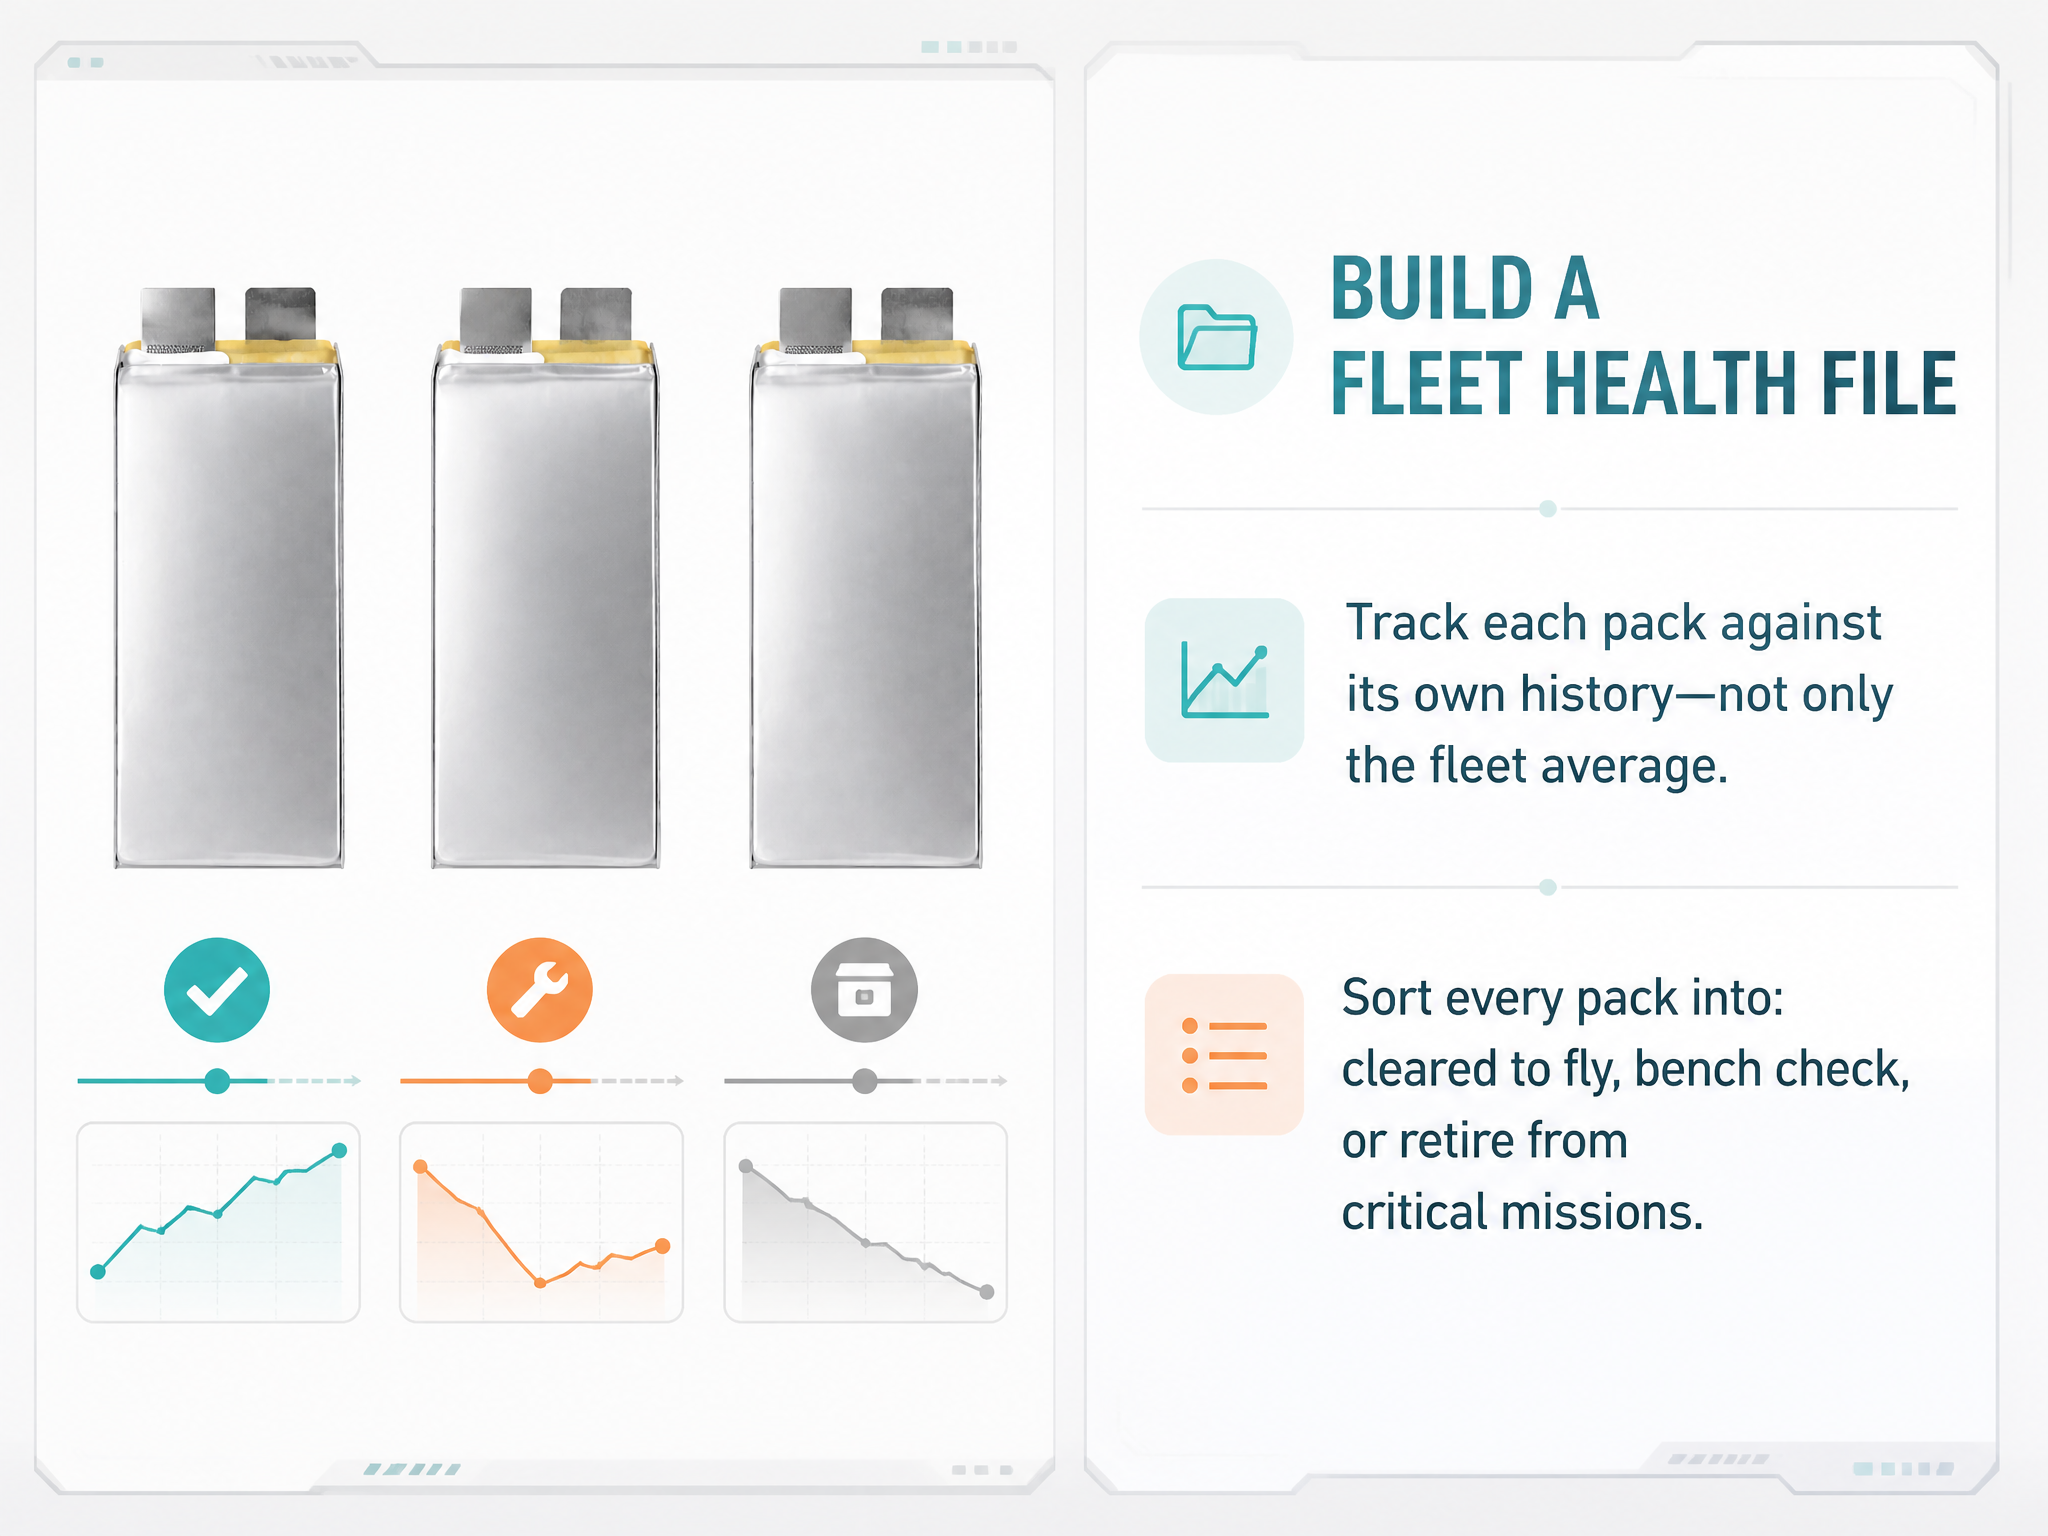
The output should answer three operational questions: which packs are cleared to fly, which need a bench check, and which should be retired from flight-critical missions.
What a BMS report cannot tell you
It cannot confirm mechanical integrity, seal condition, or terminal torque. It cannot reliably detect an incipient internal short before it becomes an event. It cannot verify actual capacity without a controlled capacity test. And it cannot tell you whether the pack matches the aircraft requirements; only the specification and the test data can do that.
A BMS report is evidence. It is not a substitute for inspection, periodic capacity testing, or a documented specification review.
What to ask your supplier
Ask which fields the BMS logs and at what interval; which SOC estimation method is used; how SOH is calculated and against which baseline; under which conditions DCIR is measured; which cell-level voltage and temperature thresholds trigger protection; how many sensors exist and where they sit; and what delta V and temperature-spread limits are recommended for that specific pack. A supplier who answers these questions precisely is easier to work with when a pack starts behaving unusually.
Conclusion
SOC tells you what the BMS believes is left. SOH tells you how much the pack has changed. Delta V tells you how evenly the cells are working. Temperature tells you where the stress is. Resistance trend tells you where it is heading.
None of these numbers is a verdict on its own. Tracked per pack over many flights, they become a fleet health record: the basis for dispatching with confidence and for retiring packs before the pack decides the question for you.
ULi — Dongguan Youli Electronic Technology Limited Email: info@uli-power.com Phone: +86 18565703627 Web: www.uli-power.com
ULi builds NMC and LiFePO4 pouch battery packs for industrial UAV, agricultural drone, and FPV platforms, with pack design, BMS configuration, and telemetry support. Share your aircraft current profile, mission temperature range, and the data fields your fleet needs to start a specification review.
SEO Keywords: drone battery BMS report, how to read BMS data, drone battery SOC, drone battery SOH, cell imbalance delta V, drone battery temperature, internal resistance trend, UAV fleet battery health, LiPo battery BMS, agricultural drone battery maintenance
Post time: Nov-17-2026